Report, Calendar, Map and Flows view
Gold-Vision data can be viewed in a variety of formats in the system.
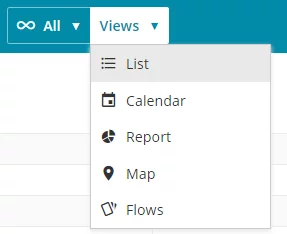
From the views drop down options users can select which view is required.List View
is the most popular view in the system and this will display a list of all the items e.g. list of all Contacts in the systemCalendar View
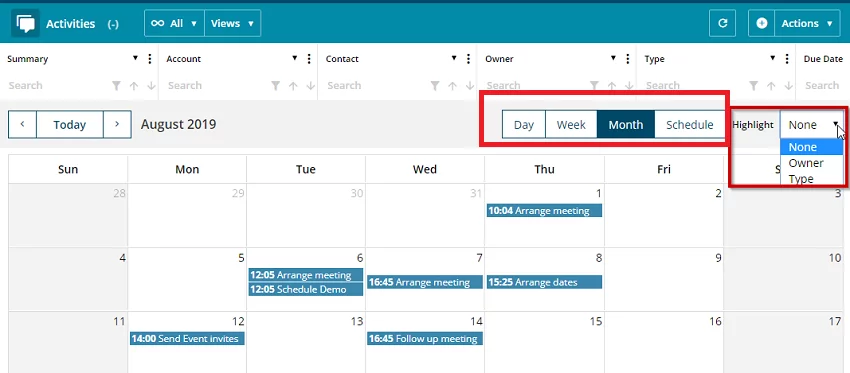
Lists with date fields, for example Appointments, an Activities list with Start or Due Dates or or an Opportunities list with Estimated Close Dates can be viewed as a calendar.
Drill-down
Click to view Day/Week/Month/Schedule view.Highlight
Users can highlight (categorise) the calendar view by selecting an option from the Highlight drop down from the toolbar. When the user selects a highlight option the screen will refresh and the items on the calendar will be highlighted according to the selected option value.Report View
Create and view widgets (charts, tables and counts) based on the data in your list. See Creating Charts and Reports for more information.Map View
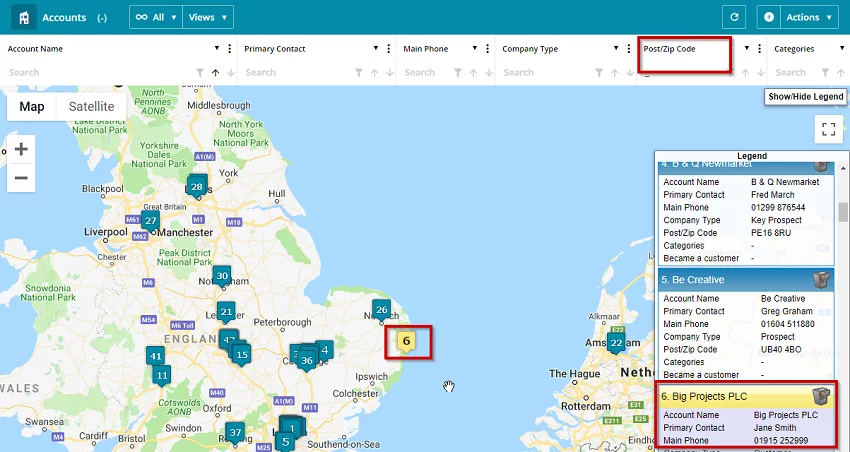
To use the Map view, ensure that you filter a list and include a Geo-coded column header, such as post code. Click the Map tab and you will be able to see your filtered list, for example Accounts in a Map view.
Clicking on a pin will highlight the Account in the legend. To open the Account record click the Account Icon.
Grouping and sub-grouping in Map View
Where there are more than approximately 100 items the location will be shown in groups and at the centre of this ‘group’ will include a number for the amount of Accounts/Contacts within this one area. The information can be broken down further by sub-groups for example by Account Manager or by Industry; this allows more specific filtering.Flows View
The Flows view allows users to see data (for example Projects) in a view showing cards with ‘swimming lanes’. Items can be dragged and dropped in to different lanes.
 Tip
Tip
Pin a filtered Flow view to a menu or homepage for quick access as filters will be saved.


 Related articles