Creating Sales Target Charts
Creating Target Dashboards
- Target dashboards can be created from the Sales or Forecasts Lists.
- Firstly, within either menu change the ‘State’ to ‘All’ and select a custom date.
 Info
Info
In settings, you can create custom date periods to match Financial dates used by your business
- Click on ‘Views’, select ‘Report’ and then ‘Create a New Widget’, select ‘Target Chart’.
- There are 3 types to choose from: Target Chart, Heat Table and Gauge Chart.
- Enter in a unique name, define an X and Y axis and select the period to match your definition.
- Click on Save.
This can then be pinned to a Homepage Dashboard and shared with the wider team.
Below is an example of a ‘Sales vs Forecast’ Target chart.
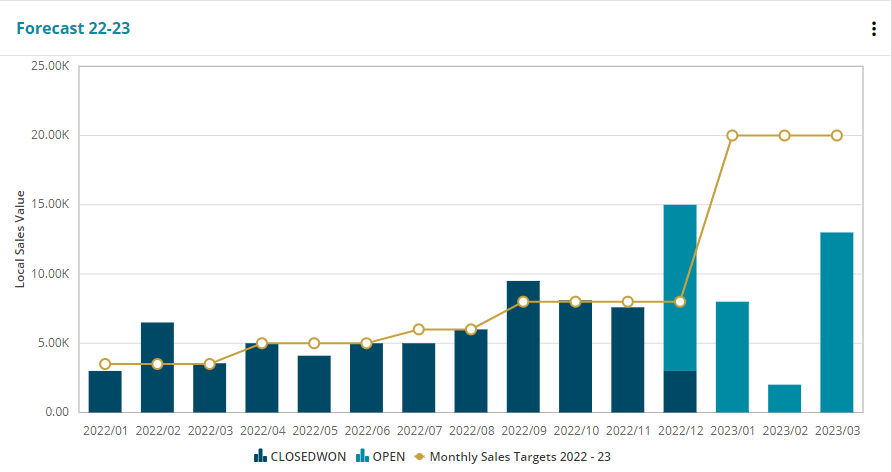
Info
Your Administrators will need to setup Targets in the Settings area, see here for more information on How To Setup Sales Target
 Related articles