Setting up Sales Charts
Here are some examples of Sale Charts you might find useful, with steps on how to create them.
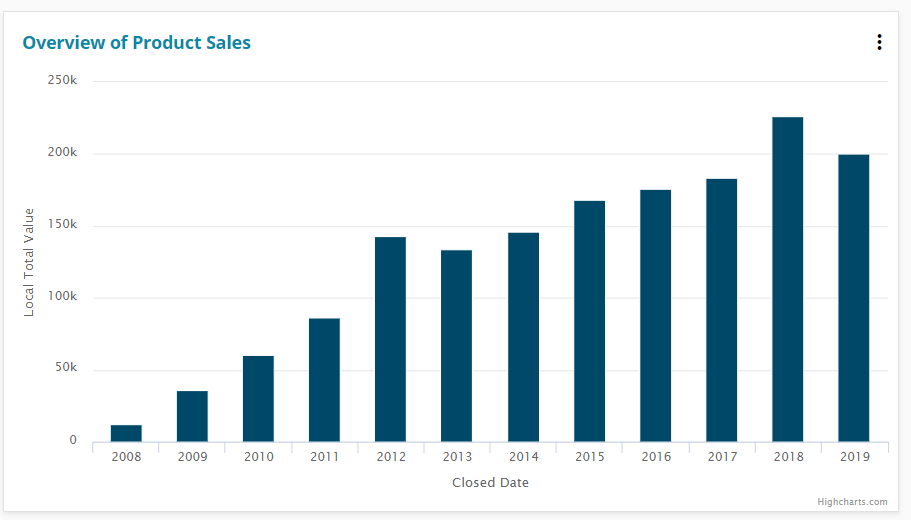
Historical overview of Product Sales
From Product Sales List, filter all Closed – Won Product Sales, clear all dates and create a Column chart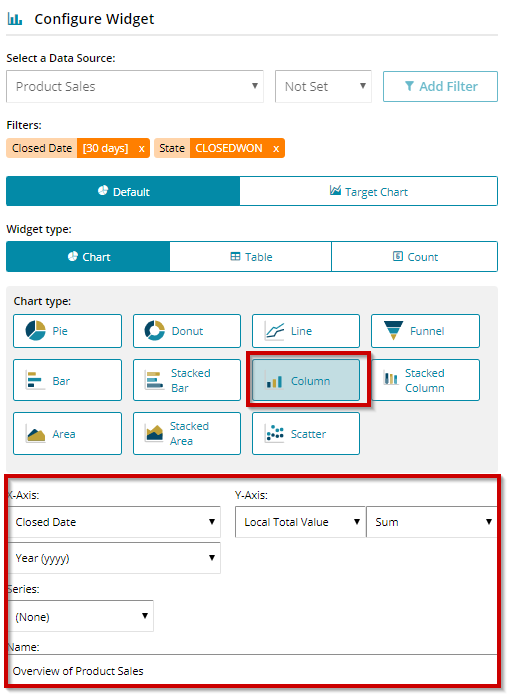
 Info
Info
You will need access to Products to create these charts.
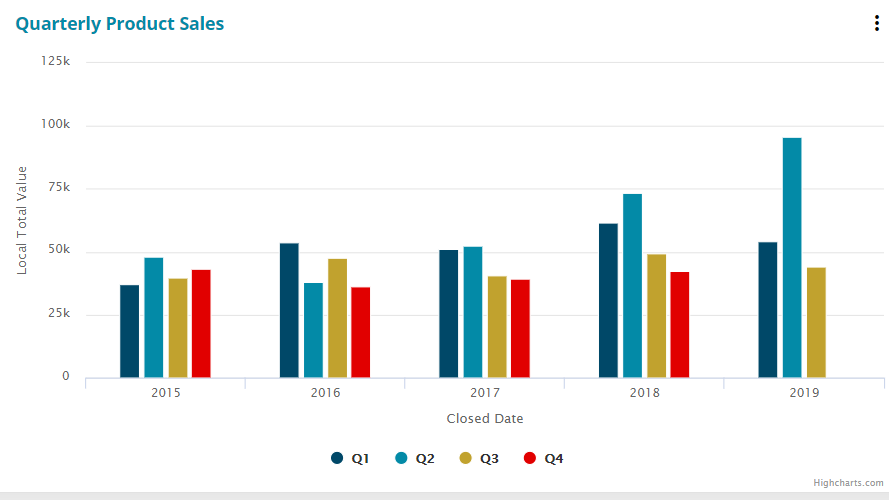
Quarterly overview of Product Sales
From Product Sales List, filter all Closed – Won Product Sales Closed Date: select the date range and create a Column chart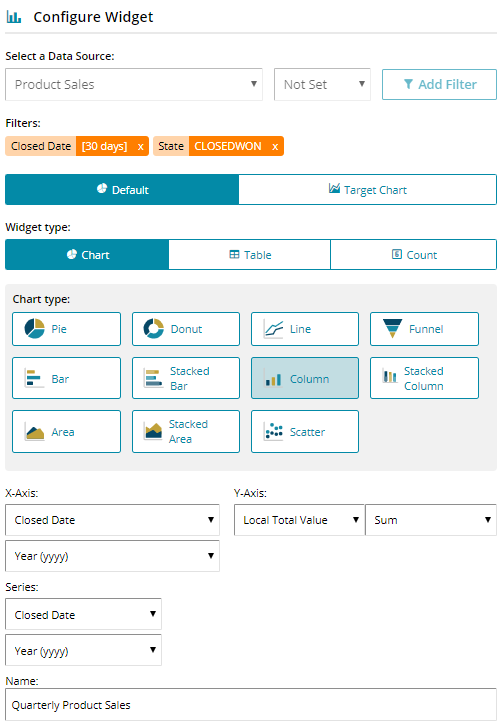
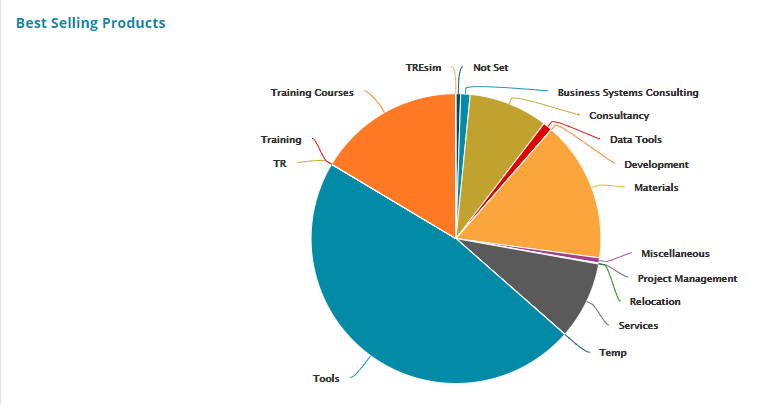
Best Selling Products
From Product Sales List, filter all Closed – Won Product Sales select the date date and create a Pie Chart.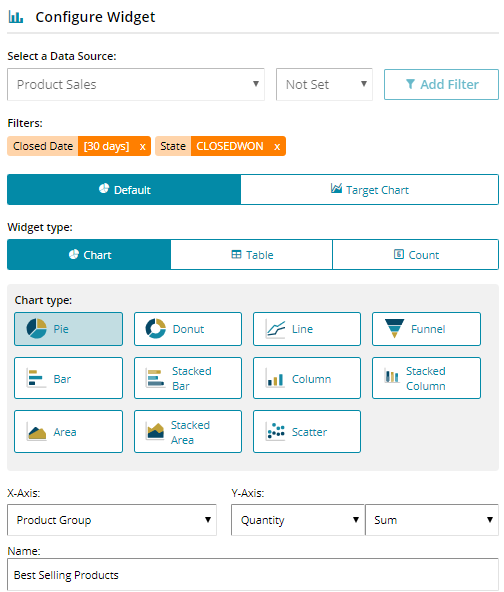
Not sure which to set as the X and the Y axis? See our tips page!
 Related articles