Creating A Target Chart
Charts, tables and counts are known as Widgets and can be created from lists or Home Pages.
Target charts are a special type of chart that show performance against Product Sales, Leads, Appointments and Activities or Product Group targets.
 Info
Info
Targets can be set in the Settings area. You need to be an Admin to complete this task.
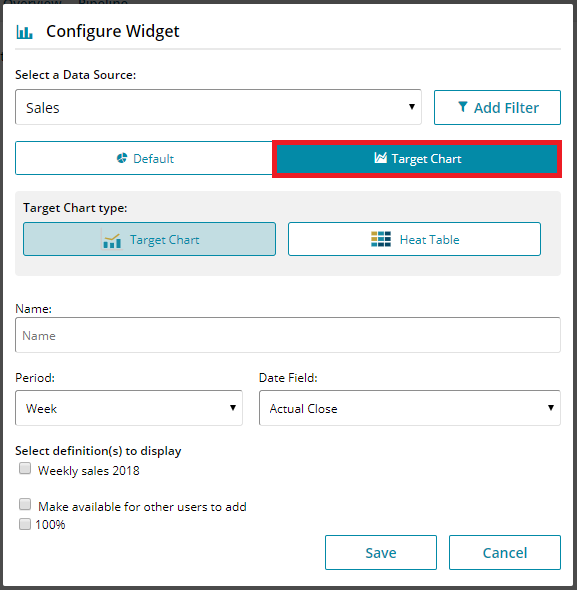
Enter a name and select the time period that your Target has been created for, this will display a list of the Targets available.
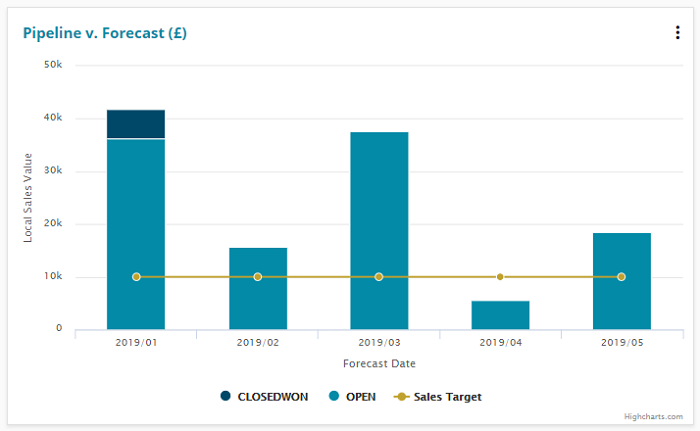
This is an example of a ‘Pipeline vs Forecast’.
You can also create user targets based on the local margin value and margin percentage of quotes from the sales and forecasts lists.
You can define user targets based on:
- local margin value
- margin percentage
They can be set per week, month, quarter and year.
You can create target charts and heat tables based on margin user targets for the sales list and forecast list.
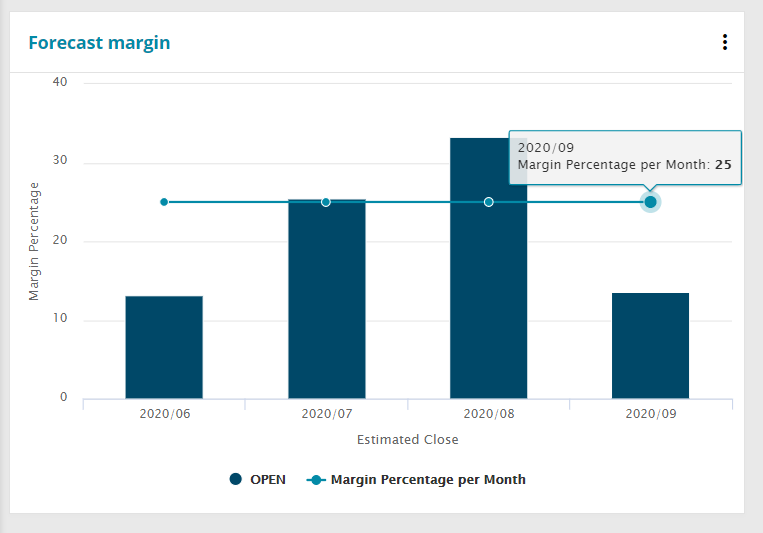
This is an example of a Monthly Margin percentage target chart:


 Related articles