Event Reporting
Create a Chart or Report
Reports can be created from any of the Event lists available.
For Sales and forecast reporting you can also use the Product Sales List for Open and Closed Bookings.
 Tip
Tip
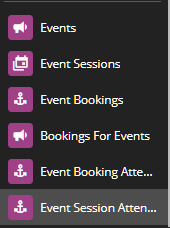
If you use a Booking for multiple Events you will need to use the “Booking for Events” list for your reporting. This will include one Booking reference number and show multiple Events.
The “Event Sessions Attendee” List provides a view of all Attendees by Session if you use Sessions to split your Events.
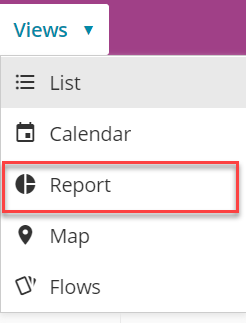
To create a new Chart, Widget or Report you can start by filtering one of the above Lists. Change the View to Report as shown below and select to Create a Chart.
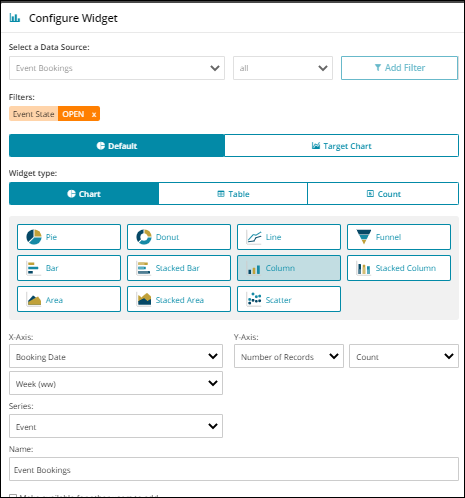
The settings used to create the Column Chart are as follows.
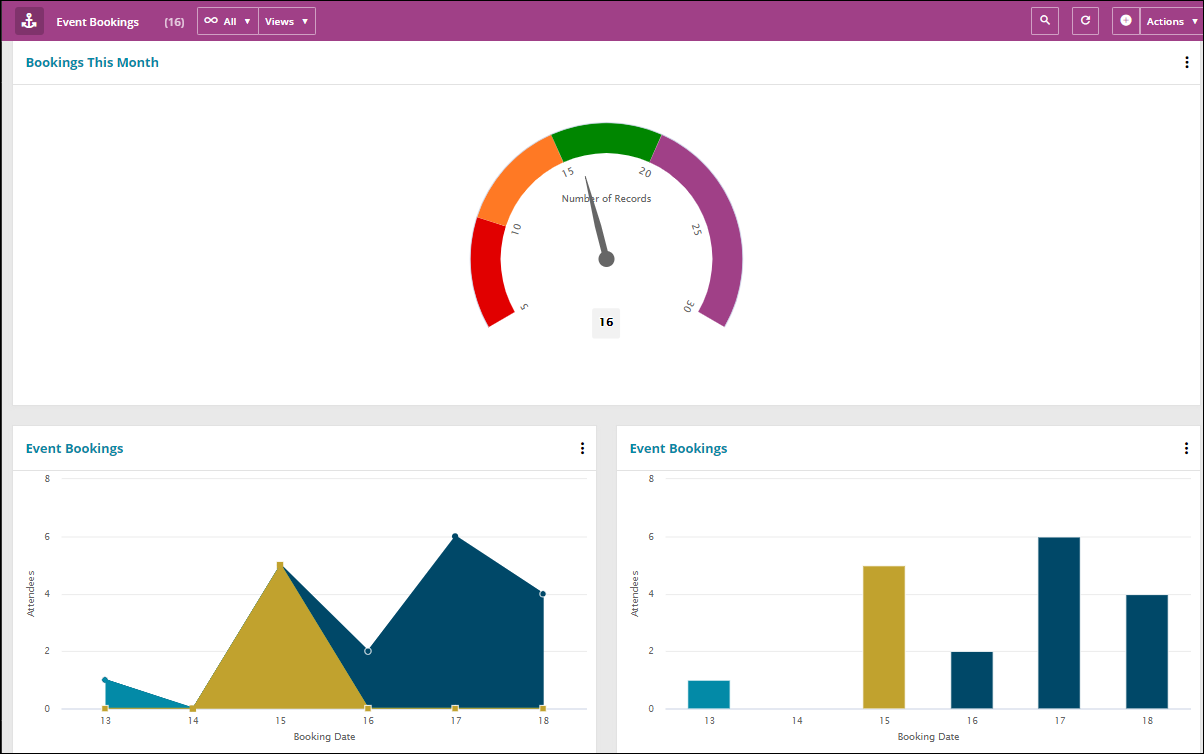
The example below also uses a Gauge Chart
 Related articles